Football
Sports Predictions History: How Forecasting Went From Tipsters to Artificial Intelligence

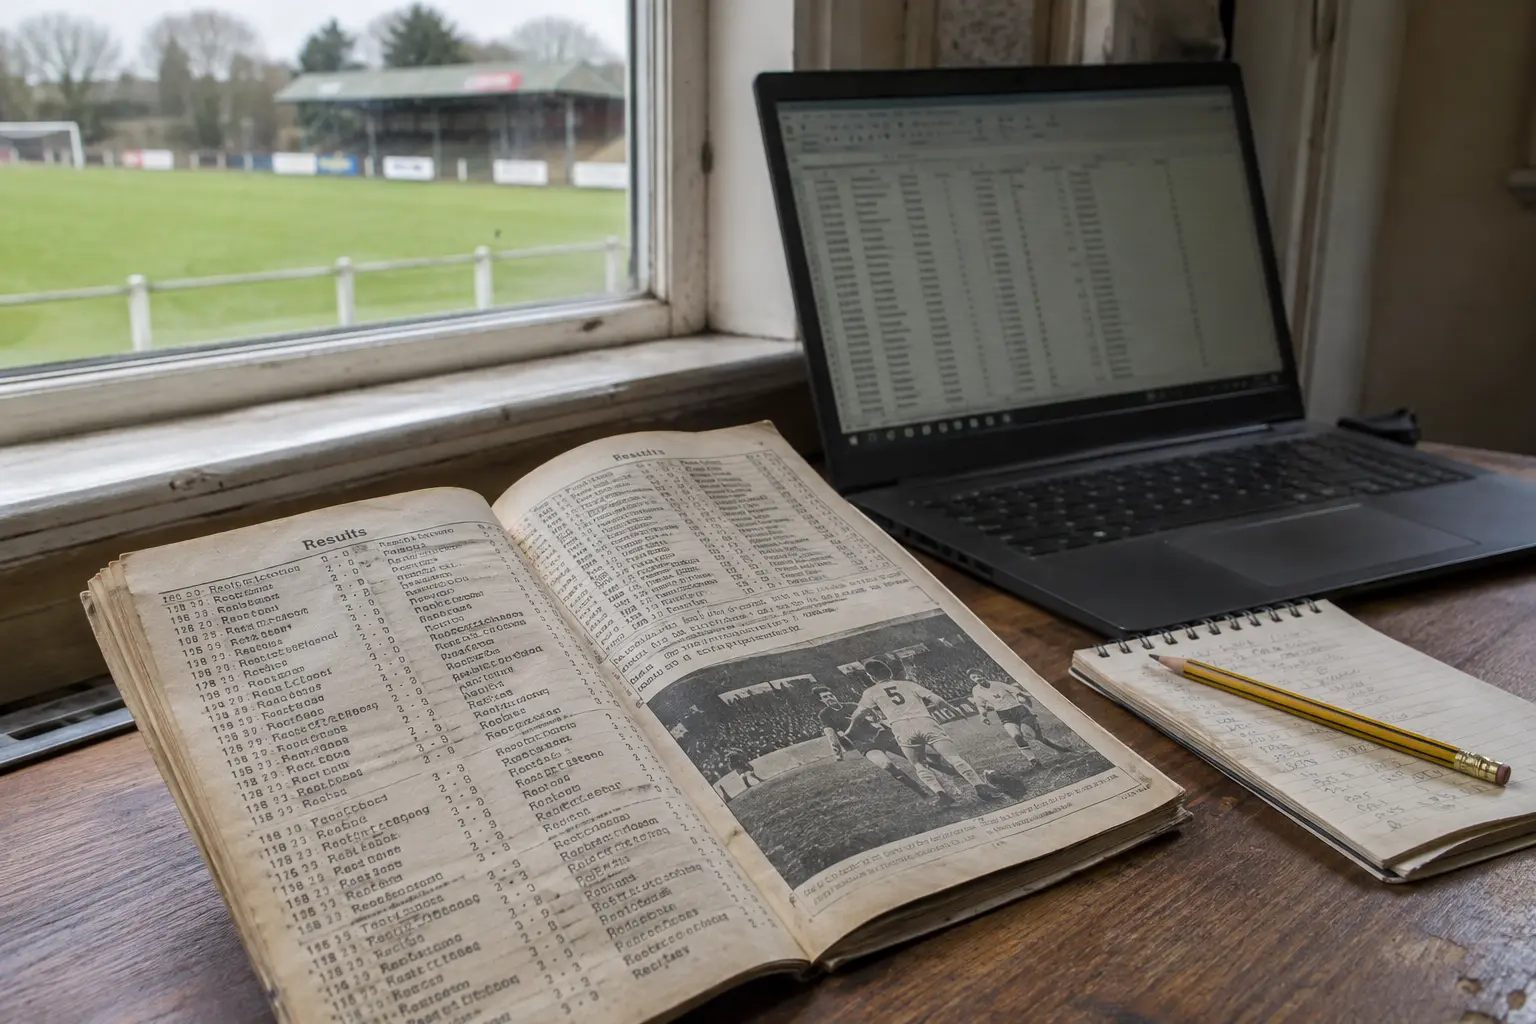
Sports predictions have developed over more than two centuries, moving from horse racing records and newspaper tipsters to statistical models and artificial intelligence. Published racing calendars documented results in the 18th century, while football forecasting grew alongside the pools in the 1920s. Today, analysts use team ratings, expected goals and machine learning to estimate probabilities before and during matches.
The purpose has remained recognisable: use what is known about a contest to make a judgement about what could happen next. The biggest changes concern the information available, the speed at which forecasts are produced and the ways their accuracy can be tested.
The history of sports predictions at a glance
| Period | Development | What it changed |
| 18th and 19th centuries | Racing calendars and specialist sporting newspapers | Made results, entries and expert comment easier to follow. |
| 1920s | Football pools and newspaper predictions grew in Britain | Brought regular match forecasting to a much larger audience. |
| 1960s and 1970s | Rating systems and organised statistical research developed | Created systematic ways to compare competitors and measure performance. |
| 1980s and 1990s | Football score models and computer-assisted racing analysis advanced | Made it easier to calculate probabilities across many potential outcomes. |
| 2000s | Online bookmakers and betting exchanges expanded | Made odds and changes in market opinion more visible. |
| 2010s onwards | Detailed event data, tracking and machine learning spread | Allowed models to use more information and update during matches. |
These periods overlap. A racing tipster can still study form by hand, just as an analyst can combine a statistical model with an expert’s assessment of team news.
Horse racing and the first published form records
Horse racing gave forecasters a practical reason to keep detailed sporting records: past results helped spectators and punters compare horses before they raced again.
The Racing Calendar documented contests in Britain and Ireland in the 18th century. A volume covering 1773, preserved in the National Trust’s collection, lists races already run and matches arranged for future meetings. Records like these made it possible to look beyond a horse’s reputation and examine its previous performances. They were records of racing, though, not proof that every reader used them as a formal forecasting system.
By the 19th century, sporting newspapers had widened access to racing news. Publications such as Bell’s Life in London covered race schedules and results, while specialist titles including Sporting Life later served a growing readership.
A racegoer comparing two horses could consider their finishing positions, the distance, the weight carried and the conditions. Those details remain part of racing analysis. Their value depends on context: a horse that finished fourth on unsuitable ground might have run better than its finishing position suggests, while a previous winner may now face stronger opposition.
Early form study was labour-intensive. Someone had to collect results, decide which performances mattered and make a judgement about how they applied to the next race. Modern databases automate much of that collection, but choosing useful comparisons is still a forecasting problem.
Football pools brought predictions into British homes
Football pools made predicting match results a weekly activity for millions of people in Britain during the first half of the 20th century.
Participants selected results from a coupon and entered a shared prize pool. The details of pools games varied, but identifying drawn matches became closely associated with the British football pools. Unlike a single fixed-odds wager, a pool competition could depend on how many other entrants made successful selections and how the prize fund was distributed.
The scale of the change was considerable. Research into the interwar pools industry describes a localised product in 1923 becoming a national activity by the late 1930s, with an estimated eight to ten million adults taking part each week. That history helps explain why football predictions became useful newspaper content: readers had a reason to compare opinions before submitting their coupons.
According to a study by economists David Forrest and Robert Simmons, The People began carrying a football forecasting column in 1925. Tipsters later became a familiar part of the sports pages, predicting home wins, draws and away wins.
The football pools also shaped the questions forecasters asked. Predicting which team was stronger was useful, but identifying matches likely to finish level required a different judgement. A match between evenly rated teams could be attractive to a pools entrant even when neither side was a clear favourite.
How newspaper tipsters made their selections
Newspaper tipsters relied on sporting knowledge, recent results and information about the teams or horses they covered. Their selections condensed that research into a verdict a reader could use quickly.
In football, a tipster might compare league positions and recent form, then adjust for an injured striker or a fixture played soon after a demanding cup match. A racing correspondent could examine a horse’s previous runs and the anticipated going. These judgements blended recorded facts with interpretation.
That approach has one lasting advantage: a knowledgeable observer can notice circumstances a simple model has missed. It has an equally lasting weakness: people can give too much weight to a memorable performance or a familiar team.
Forrest and Simmons studied three newspaper football tipsters across 1,694 English league matches. The tipsters performed better than random forecasting, but the researchers found that they did not fully use readily available information about team strength. The study also found that a consensus forecast outperformed any of the individual tipsters. Those findings describe the people and matches studied, rather than every tipster in every era.
A useful distinction follows: a correct prediction does not reveal which information produced it. To assess a tipster, a reader needs a record of all the selections, including losing ones, over a meaningful period.
Betting odds became a public forecast
Bookmakers’ odds are another way to express an assessment of a sporting outcome. They give readers a price, which can be converted into an implied probability.
At decimal odds of 2.00, the simple implied probability is 50%. At 4.00, it is 25%. The calculation is one divided by the decimal odds. Fractional odds can be converted too: 3/1 is equivalent to 4.00 in decimal form.
Bookmakers usually build a margin into their prices. As a result, the implied probabilities across every possible outcome commonly add up to more than 100%. They therefore should not be treated as perfectly calibrated probabilities without accounting for that margin.
Odds are informative because they reflect more than one person’s prediction. A bookmaker considers available information and may adjust prices as market conditions and bets change. Different operators can also offer different prices at the same time.
The relationship between odds and prediction has made markets a demanding benchmark. A model that predicts football results more accurately than random guessing has achieved something useful, but a bettor would need to establish whether its probability estimates improve on the prices available when the bet could actually be placed.
Elo ratings made sporting strength easier to compare
The Elo rating system gave forecasters a repeatable way to describe the relative strength of competitors and update that assessment after a result.
Physicist Arpad Elo developed the system for chess. The United States Chess Federation adopted it in 1960, and the International Chess Federation followed in 1970. A competitor’s rating changes according to the result and the expected score against the opponent: beating a highly rated rival generally moves a rating more than beating a much weaker one.
Although a rating is not the same thing as a complete forecast, the gap between two ratings can be used to estimate an expected result. The system’s appeal is that every result updates an ongoing assessment rather than being considered in isolation.
Elo-based methods spread beyond chess. FIFA introduced a new calculation for its men’s world ranking in August 2018 based on the Elo model. Researchers have also used Elo ratings to predict football matches, although different versions can handle home advantage and draws differently.
Ratings have limits. A number built from past results may respond slowly to a managerial change, a major transfer or an injury. It is an assessment of strength based on the information and assumptions in that particular system, not a guarantee of the next result.
Baseball showed what performance statistics could reveal
Baseball analysts helped establish the idea that a team’s underlying performance could be more informative than its win-loss record alone.
The Society for American Baseball Research, known as SABR, was founded in 1971. Writer Bill James published the first edition of his Baseball Abstract in 1977 and later popularised the term sabermetrics for the statistical study of baseball. His work asked which measurements explained performance and which familiar statistics could mislead.
One example is James’s Pythagorean expectation, which uses runs scored and runs conceded to estimate a team’s expected winning percentage. A team winning many close games might finish with a better record than its scoring record suggests. That difference invites a question about whether the same win rate is likely to continue.
The lesson for sports predictions reaches beyond baseball. A football team may win several matches despite conceding many good chances. Results still count, but a forecaster interested in future games has reason to examine how those results were achieved.
Statistics do not make judgement redundant. Analysts must decide which measurements are relevant, how much past performance to use and whether changes in personnel make an older record less useful.
The rise of computer models in horse racing
Computer-assisted racing forecasts made it possible to assess far more combinations of form and price than a person could comfortably calculate by hand.
A prominent example is William Benter’s work on horse race prediction in Hong Kong. In a report on computer-based handicapping, Benter described the data requirements and statistical methods used in a forecasting system. His approach combined a model based on race information with estimates implied by the public’s betting choices. He reported positive results over five years of implementation.
The combination matters because the betting public also holds information. If a model finds that a horse looks strong, but the price already reflects that strength, identifying the likely winner alone does not establish that the bet has value. Benter’s work treated the public’s assessment as an input to be considered alongside the model’s own calculations.
His reported results concern a particular operation and period. They are not evidence that anyone can reproduce the same performance in current markets. They do show an important stage in prediction history: the forecast and the available price had become separate quantities to compare systematically.
Poisson models changed football score predictions
Poisson models estimate how often goals are likely to be scored and use those estimates to calculate possible scorelines.
In 1982, statistician Michael Maher examined football scores using a model that incorporated teams’ attacking and defensive strengths. His research found that an independent Poisson model gave a reasonably accurate description of score frequencies, while identifying ways to improve its fit.
The idea can be explained with a simple example. If a model estimates that the home team will average 1.6 goals in a particular fixture and the away team 1.0, it can assign probabilities to scores such as 1-0, 1-1 and 2-1. Adding the probabilities for every home-win score gives an estimated chance of a home victory.
Those goal averages are model inputs, not promises that either team will score a fractional goal. A scoreline with the highest individual probability can still be less likely than all other scorelines combined.
In 1997, Mark Dixon and Stuart Coles published a football forecasting model using English league and cup data. Their research accounted for the changing nature of team performance and examined a betting strategy against bookmaker odds from the period studied. The authors reported a positive return in that historical test. That finding should not be assumed to hold for later seasons or modern odds.
The importance of these models was their structure: a forecast could be expressed as a set of probabilities and checked against a large collection of actual results.
The internet made predictions and prices easier to compare
Online betting and sports websites changed the speed at which people could obtain predictions, check odds and follow results.
Readers no longer depended on a newspaper column arriving on a particular day. They could compare previews, update their view after team news and look at prices offered by several operators. Digital archives also made it easier to record forecasts and assess past performance, provided the original predictions were preserved.
Betting exchanges added another form of price discovery. Betfair launched in 2000, allowing customers to bet against one another through an exchange. A user could back an outcome or lay it, taking the opposing position, subject to the exchange’s rules and charges.
Exchange prices can change as participants respond to new information. They can also be affected by how much money is available at a particular price. A thinly traded market may therefore tell a different story from a heavily traded one.
The internet widened access to forecasts, but it did not make every prediction easier to evaluate. A website can highlight its best results while omitting long losing runs. A reliable track record needs dated selections, the odds available when they were published and an explanation of how returns are calculated.
Expected goals added context to football results
Expected goals, usually written as xG, estimate the probability that a shot will result in a goal based on the characteristics of that chance.
A close-range shot from a central position generally has a higher xG value than an attempt from a difficult angle at distance. Adding the values of a team’s shots gives an estimate of the goals associated with those chances on average. Data provider Stats Perform describes factors including shot location and the type of assist in its xG explanations.
Suppose one team records 2.0 xG and the other 0.6 xG. The first team created the better chances according to that model, even if the match finished 0-0. That does not mean it deserved to win a specific match by two goals, nor does it tell us the next match’s score.
For forecasting, the more useful question is whether chance creation and concession across several games help explain a team’s underlying strength. Analysts can combine that information with the opposition faced, home advantage and changes in the starting line-up.
Different providers build xG models differently, and a model cannot measure every relevant detail perfectly. A recent study of Bundesliga forecasting examined xG-based models alongside betting prices and assessed both predictive performance and betting returns, illustrating why those questions should be considered separately.
Machine learning and live sports predictions
Machine learning models use historical examples to identify relationships between inputs and outcomes. In sports forecasting, those inputs might include team ratings, player availability, recent performances and betting prices.
Some approaches use relatively simple statistical relationships. Others use decision trees, random forests or neural networks to capture more complex patterns. The label “AI prediction” on its own does not explain which data were used, how a model was trained or how its forecasts performed against an alternative.
Live predictions add another challenge: the circumstances change while the event is taking place. A football forecast can be updated after a goal, a red card or an injury. A tennis model might account for the current score and who is serving. Stats Perform describes pre-match and live outcome probabilities among its predictive products.
More data can help, but only if the information is available at the time of the forecast and improves the estimate. A model trained on final match statistics would give a misleading impression of its pre-match ability if those statistics were accidentally included in the test.
The same applies to changes in the sport. A model trained on several seasons of one league may struggle after a change in teams, playing styles or competition format. Forecasting systems need to be checked on later, previously unseen events rather than judged only on the data used to build them.
Famous predictions and the problem of hindsight
Memorable correct predictions attract attention, but a single success is weak evidence that a forecasting method works.
Paul the octopus became famous during the 2010 FIFA World Cup after correctly selecting the winners of eight matches. A research letter discussing his run used it to illustrate a wider problem: striking results are much more likely to be noticed and reported than the many unremarkable sequences that receive no attention.
The same selection effect applies to human pundits and prediction accounts. A person who publicly backs a surprising champion may be celebrated years later, while unsuccessful picks made by the same person are forgotten. Seeing the complete record provides a fairer picture.
Probabilities also change how an upset should be interpreted. If a team has a 10% chance of winning, its victory will be unusual, but it is still one of the outcomes the forecast allowed. Calling the 90% favourite a poor prediction after one defeat confuses the result of one event with the quality of a probability estimate.
Prediction accuracy and betting profit are different measures
A forecaster can choose more winners than a rival and still produce a lower betting return. The difference is the price attached to each selection.
Consider two hypothetical records, each consisting of 100 bets of £1 at the same decimal odds. Returns include the original stake on winning bets:
| Forecaster | Winners | Decimal odds | Total returned | Profit or loss |
| A | 60 | 1.50 | £90 | £10 loss |
| B | 45 | 2.50 | £112.50 | £12.50 profit |
A has the better strike rate, but the lower average price is not enough to recover the £100 staked. B wins less often and still makes a profit in this illustration. Real results vary, and these examples exclude commission, taxes and price changes.
The break-even probability at decimal odds of 2.50 is 40%, before charges. If the true probability were 45%, a £1 bet at those odds would have an expected return of £1.125, or an expected profit of 12.5p per bet. That is a mathematical expectation over repeated equivalent bets, not a prediction of what any individual bet will earn. A model estimating that probability may also be wrong.
This distinction explains why a reliable forecast is only one part of a betting decision. A price that is favourable under one probability estimate can be unfavourable under another. Neither historical returns nor a forecast labelled “value” guarantees a profit.
How to test a sports prediction properly
A useful test compares predictions made before events with all the results that follow, using a consistent measure of performance.
For a simple winner-picking system, strike rate is the share of selections that win. It is easy to understand, but it says little about how confident the forecaster was or what prices were available.
Probability forecasts can also be assessed for calibration. If a model assigns a 60% chance to many comparable events, roughly 60% of those events should occur over a sufficiently large set. A model that repeatedly gives 90% chances to events that happen only 60% of the time is overconfident.
Scoring methods such as the Brier score evaluate the probabilities assigned to outcomes rather than only counting correct picks. Lower scores are better, and the method penalises confident forecasts when they are wrong. Researchers have examined such scoring rules specifically for football match forecasts.
A fair historical test should record:
- The forecast date and time, so it is clear what information was available.
- Every selection or probability issued during the period, including losses.
- The outcome definition, such as a football result after 90 minutes rather than after extra time.
- The actual odds used, plus any exchange commission or other relevant costs.
- Results on matches that were not used to build or tune the model.
Compare the forecast with a sensible baseline too. A football model could be checked against bookmaker-implied probabilities, a simple team-rating system or consistently choosing the favourite. Without a baseline, a headline accuracy figure can sound impressive while adding little useful information.
What sports predictions can and cannot tell us
A sports prediction estimates an uncertain future outcome using the information available at a particular time. Its usefulness depends on how well that information reflects the contest and how honestly the estimate is tested.
Past form can identify patterns without explaining every cause. An injury announced after publication can make an earlier estimate obsolete. In a low-scoring sport, one deflection or refereeing decision may have a large effect on the final result. A tournament forecast has the additional problem of predicting opponents and conditions across several rounds.
The best historical record will still contain losing predictions. The question is whether the stated probabilities and results remain consistent across a substantial sample, and whether the method continues to perform when circumstances change.
Frequently asked questions
Are sports predictions always connected to betting?
No. Journalists, supporters, teams and researchers make forecasts for editorial coverage, competition planning and analysis as well as betting. A predicted league table or tournament winner can be useful to a reader even when no money is involved.
Can historical head-to-head results predict a match?
They can add context, but older meetings may have limited relevance if players, managers or tactics have changed. A long run of results between two clubs should be considered alongside the current teams and the strength of the opposition they have faced.
Do computer predictions replace human sports experts?
No. Models are consistent at applying their rules to large amounts of data, while a knowledgeable analyst may spot information that has not entered the dataset. Combining them can be useful, provided the analyst’s adjustments are recorded and checked rather than accepted automatically.

Hi there! I'm Jake Steinberg, a passionate sports journalist with a knack for diving deep into the stories of inspiring sportsmen and sportswomen. Every athlete has a tale, and it's my mission to bring theirs to light. Join me on this journey through the highs and lows of the sporting world!